Two articles, one by Charlie Parton and another co-authored by Sarah Rogers, Jiang Min, Shi Chenhen and Zhang Wenjing, recently took different views on China’s water shortages and response measures. The debate has centred on the value of using per capita water resources as an index, and the actual state of water resources in northern China. We hope our research at the World Resources Institute (WRI) can provide a new perspective to this debate.
WRI has tracked changes in water stress in China for the period 2001 to 2015, showing how it varies across the country. We found that the establishment of a tough management system for water resources, including an approach known as the “Three Red Lines” helped reduce or even reverse the worsening problem of water stress.
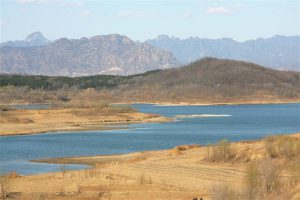
With more than one-third of China’s land area facing high or extremely high water stress, the country is working hard to match growing demand for freshwater with the available renewable supply. The government is well aware of the dangers that water stress can pose, such as economic stagnation, the demise of water-dependent industries, and conflicts over resources.
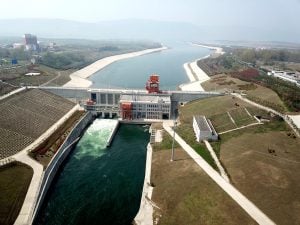
In 2012, the Chinese State Council issued an administrative guidance document, “Opinions of the State Council on Applying the Strictest Water Resources Control System”, to address growing water challenges. The document, commonly referred to as the “Three Red Lines”, requires stricter management of water resources in three ways: by capping annual water usage at 700 billion cubic metres for the overall economy by 2030, increasing irrigation efficiency, and protecting water quality. Following the central government’s lead, sub-national governments have set up their own more detailed goals.
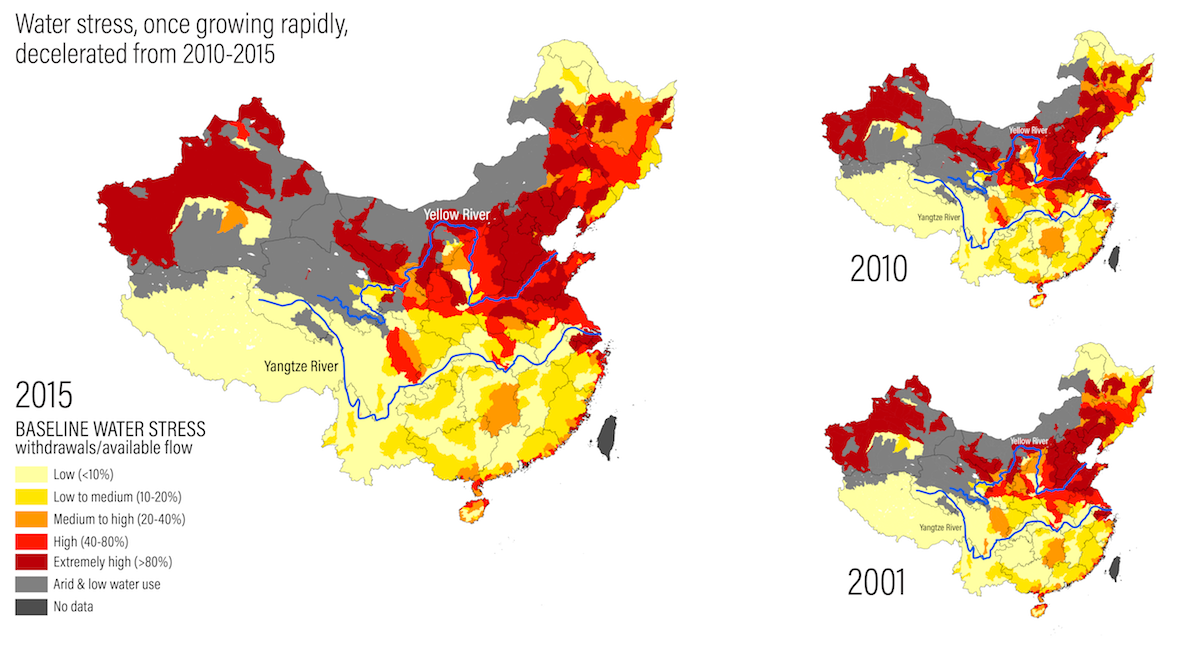
Have these Three Red Lines improved China’s water security? WRI used data on water withdrawal for three years (2001, 2010 and 2015) to determine changes in water consumption over time. "Baseline water stress" is defined as the total annual water withdrawals (municipal, industrial and agricultural) as a percent of the total annual available surface water. High values indicate more competition among users – a value above 40% is considered as “high water stress,” and above 80% as “extremely high.”
 Source: World Resources Institute
Based on these data and the related analyses, we observed a number of trends:
The overall pattern of water stress has remained consistent from 2001 to 2015. Northern China experiences more stress than southern China. Compared to 2010, the total area of China experiencing high and extremely high water stress did not change in 2015, as the Three Red Lines policy took effect.
The population living in high or extremely high water stress areas increased by 3% from 2010-2015. Compared to 2001-2010, areas at the upstream reaches of the Yellow and Yangtze rivers had less water stress, while areas at the downstream reaches of the Yellow River had worse water stress as people began to move downstream.
Water stress isn't worsening as quickly. In a recent five-year period (2010-2015), the growth in areas experiencing higher water stress slowed; the total area with worsened water stress from 2010-2015 was only 35% of the previous ten-year period (2001-2010).
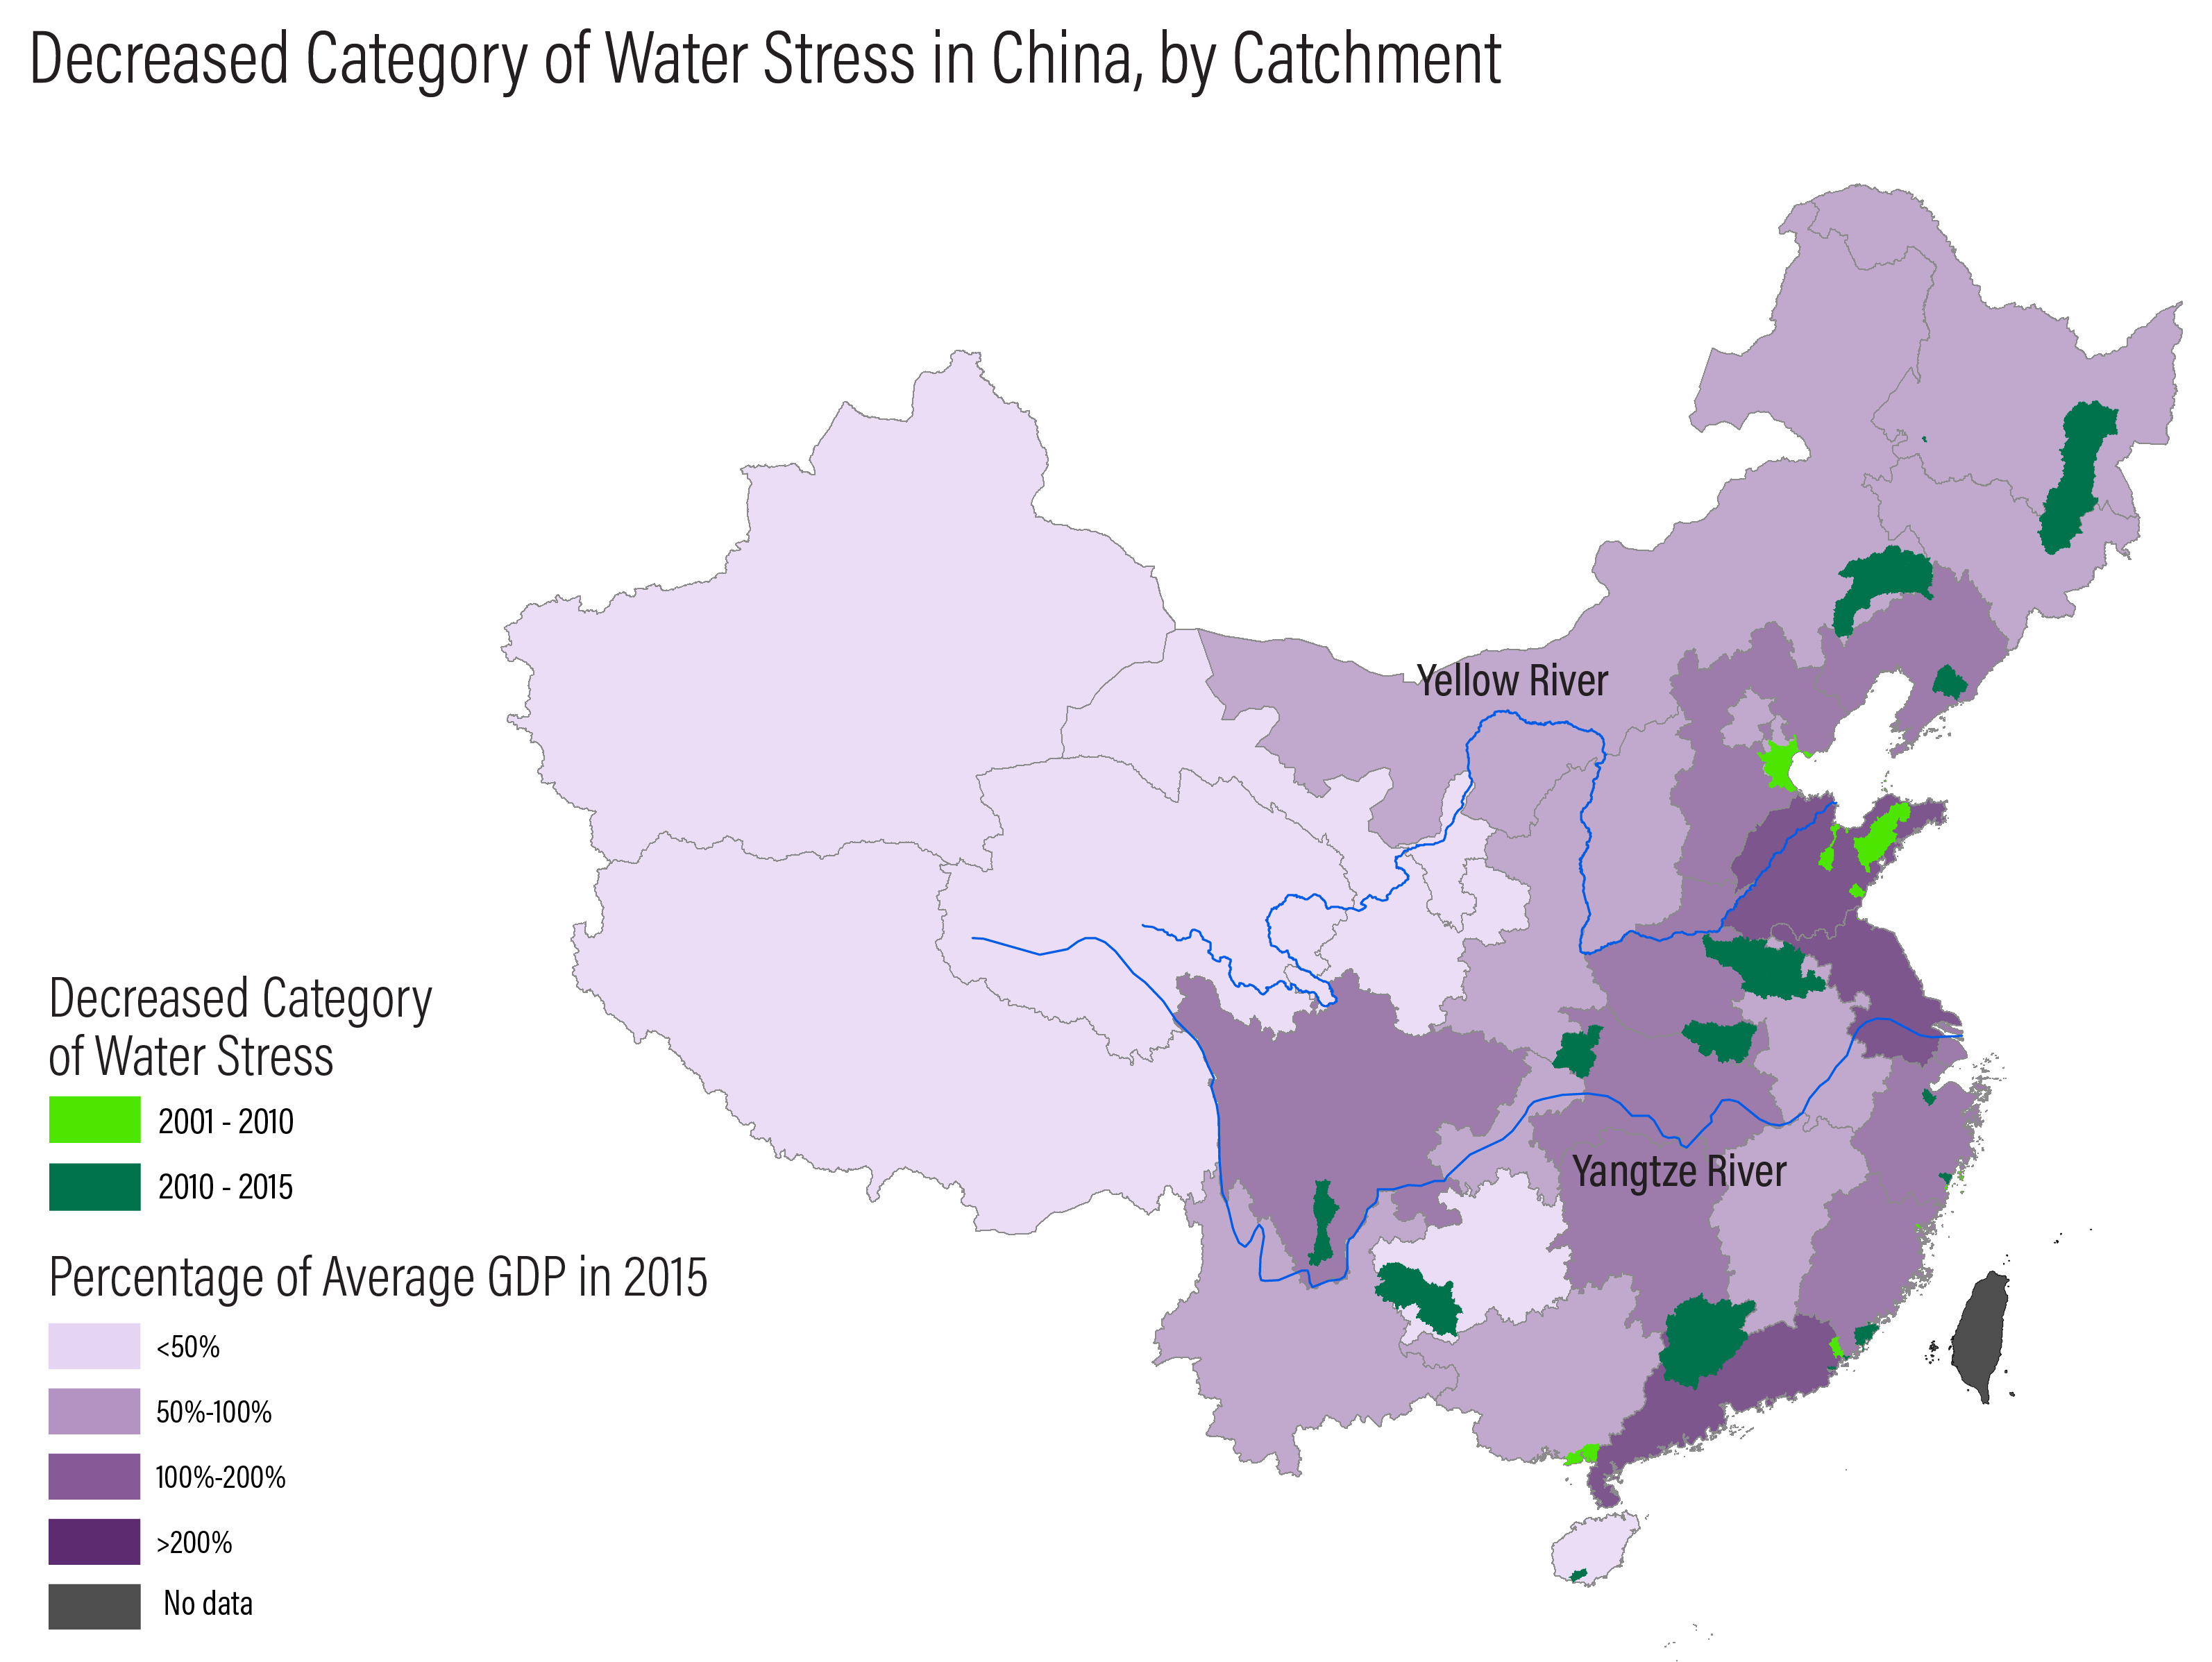
More areas are improving. The number of areas experiencing a decrease in water stress from 2010-2015 was nine times greater compared to the 2001-2010 period.
 Source: World Resources Institute
 Source: World Resources Institute
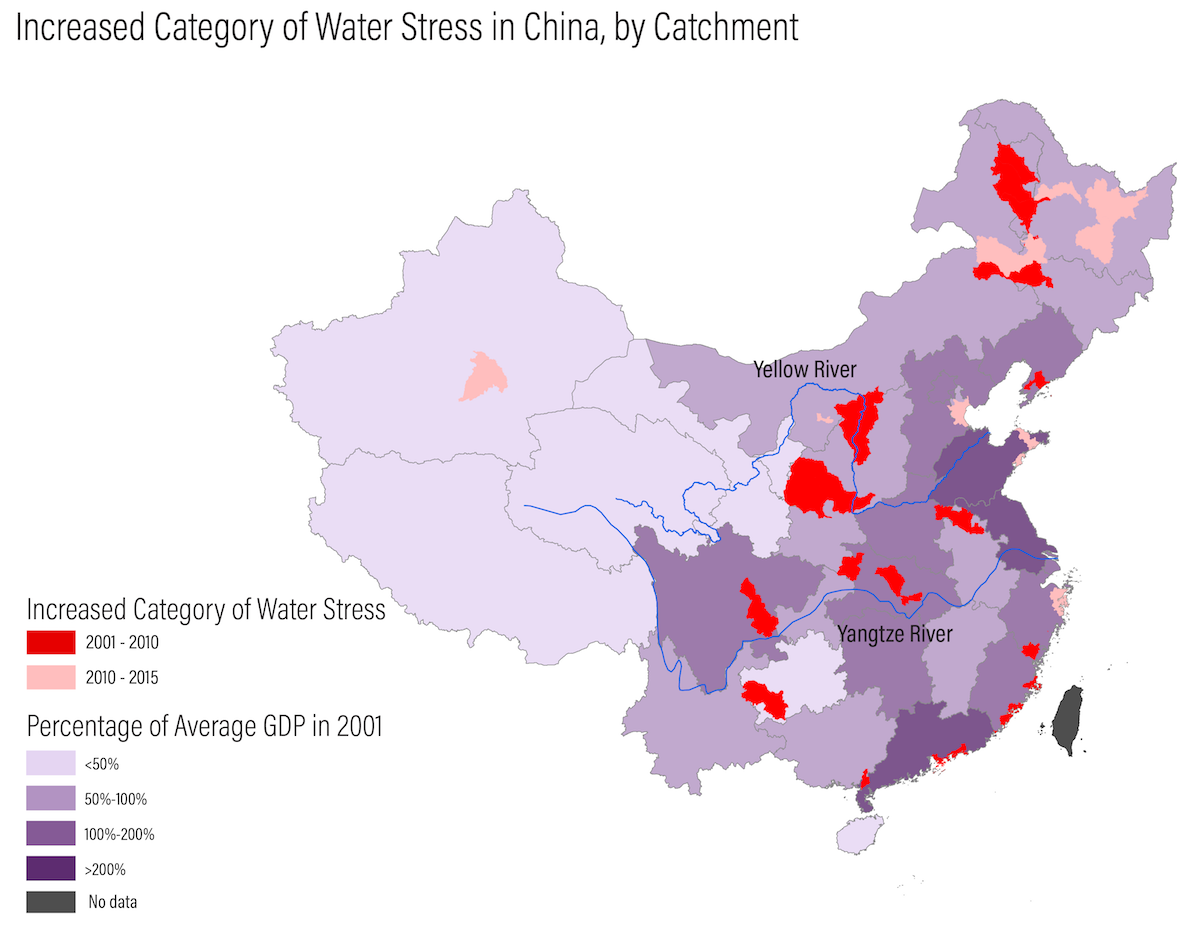
Stress declining in central China. As shown by the maps above, there are broad disparities within and between China’s various provinces. Water stress increased in central China’s provinces from 2001-2010, keeping pace with rapid regional economic growth over the same period. Since 2010, levels of water stress have started to decline in some catchments as sectoral reductions in water withdrawals have taken place.
These positive developments can be seen at the local level. For example, industrial water withdrawals in Panzhihua, which is in Sichuan province in south-west China, decreased by 31% in 2015 compared to 2010. This change was driven by incentives put in place by the Panzhihua municipal government, which aimed to decrease the water use per unit of industrial value added by 30% in 2015 compared to 2010.
In Panzhihua, 37 industrial companies were enrolled in Sichuan’s “Hundred Companies Water Saving Working Plan” issued in 2013, which targets a total of 546 companies in the province whose water withdrawal exceeds 300,000 cubic metres per year and accounts for nearly 70% of total industrial water withdrawal in Sichuan. The focus of the working plan is to “control the increment, adjust the existing, phase out the outdated” to increase water efficiency. In 2013, water withdrawal from these 37 companies decreased by 22% compared to the previous year, with an 85.4% reuse rate. It seems that the Three Red Line regulations and local government policies and incentives are having an effect.
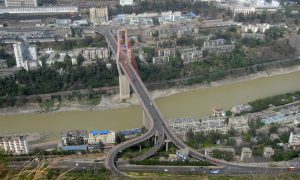
But in the north of China, the focus of the recent debate, the outlook is not positive. The northern Chinese plains and the Beijing-Tianjin-Hebei region were in a constant state of extreme water stress from 2001 to 2015. Figures categorised by industry show that the use of water for irrigation has declined, for example, by more than half in Beijing from 2001 to 2010. The watershed in which southern Tianjin is located has seen sustained falls in the use of water for irrigation between 2001 and 2015. However, industrial use of water has continued to grow.
These analyses suggest that China has started to see the positive impacts of stricter management of water resources. Although there are differences across regions – some of which are seeing stress worsen – the situation overall has improved since issuance of the Three Red Lines policy, including at the sectoral level.
Since the analysis is based on only two data points (2010 and 2015), it is not clear if this is a trend or just a blip in the data. If this trend bears out over time it will demonstrate that even relatively water-stressed countries with booming economies can improve their situations through meaningful public policies and well-aligned incentives.
This is an expanded version of a blog that was first published by WRI in April. The original is available here.
Note on date: This analysis uses WRI’s Aqueduct methodology and the NASA GLDAS global hydrologic model to assess long-term averages for renewable surface water supply, and detailed sectoral water demand data reported by the Chinese government. As is true for many countries, there is no independent verification of these self-reported demand figures. We are, therefore, relying on the accuracy of the government-reported data without the ability to check them against other sources.